
Distribution System Load Flow and Energy-Efficiency Study
Island Energy | Mare Island Distribution System Load Flow and Energy-Efficiency Study | Mare Island, Vallejo, California
Project Overview
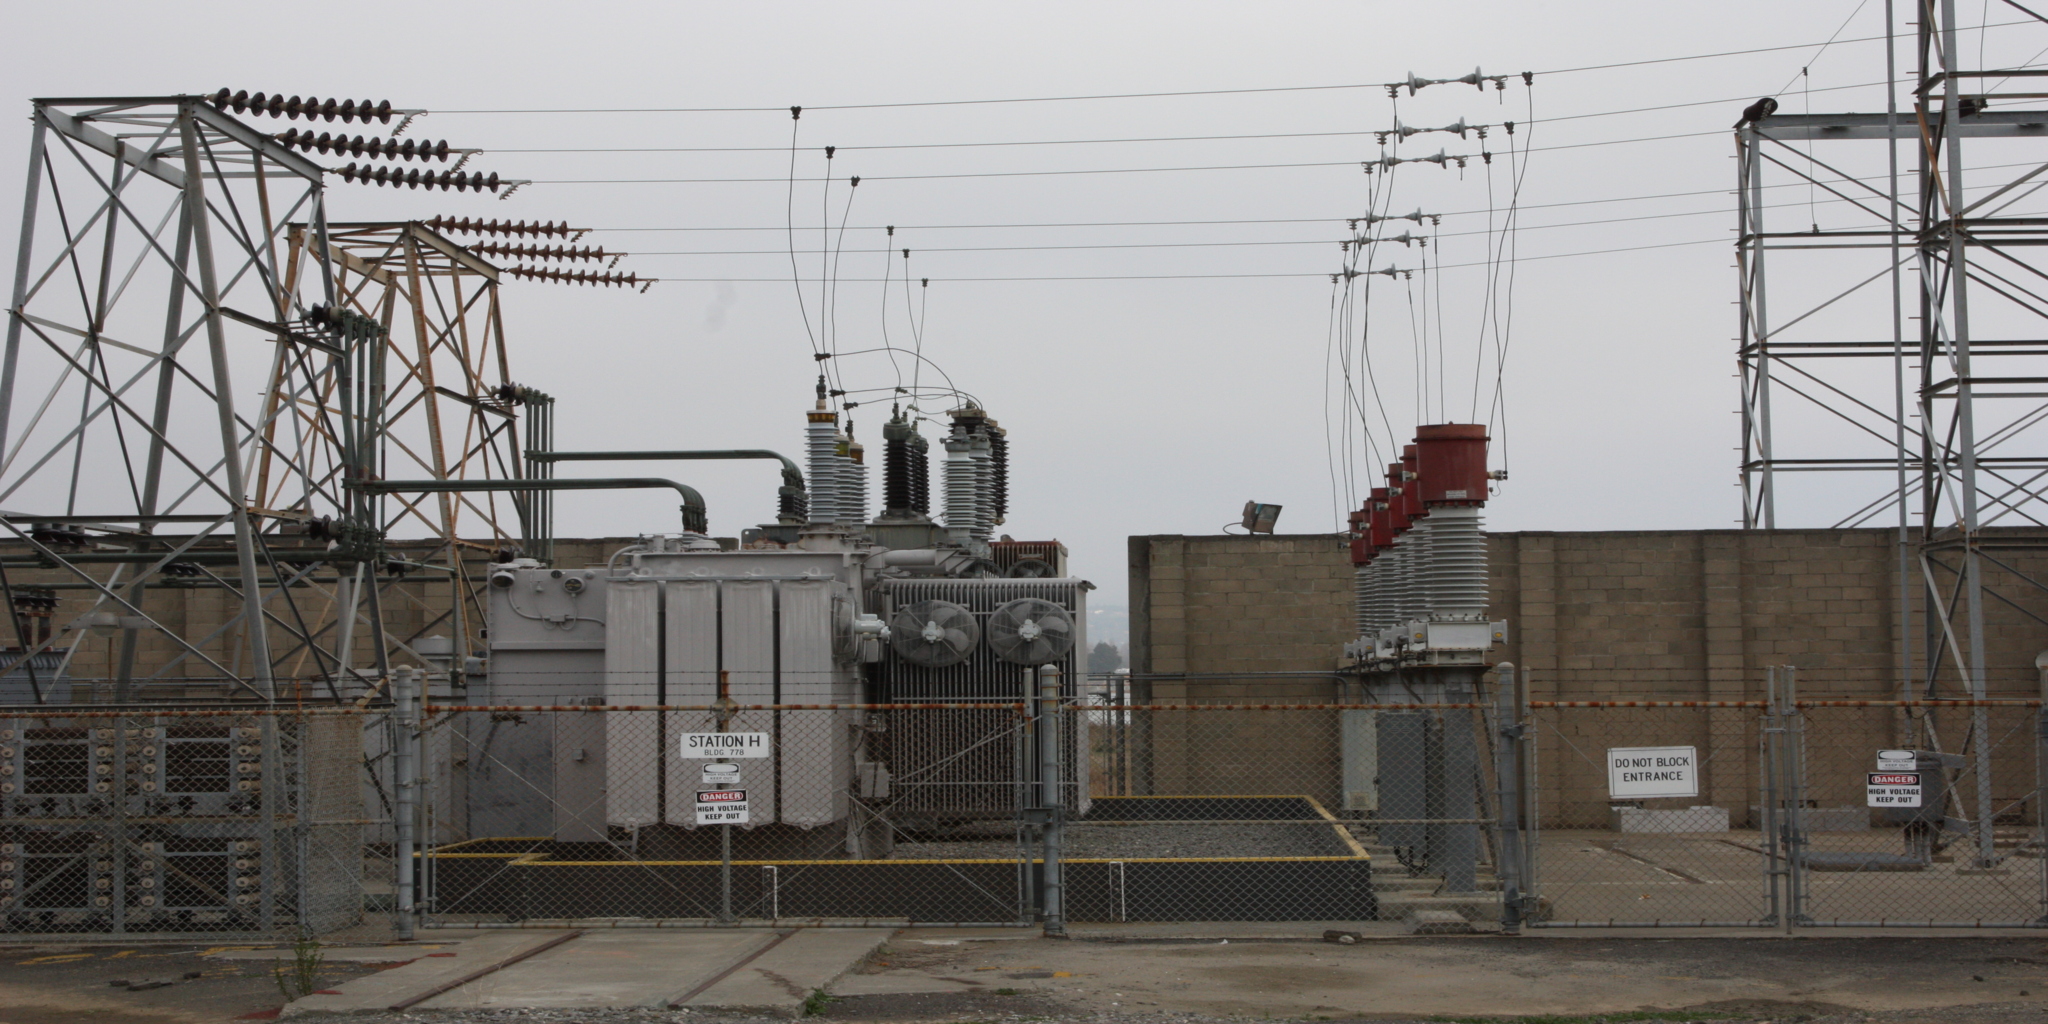
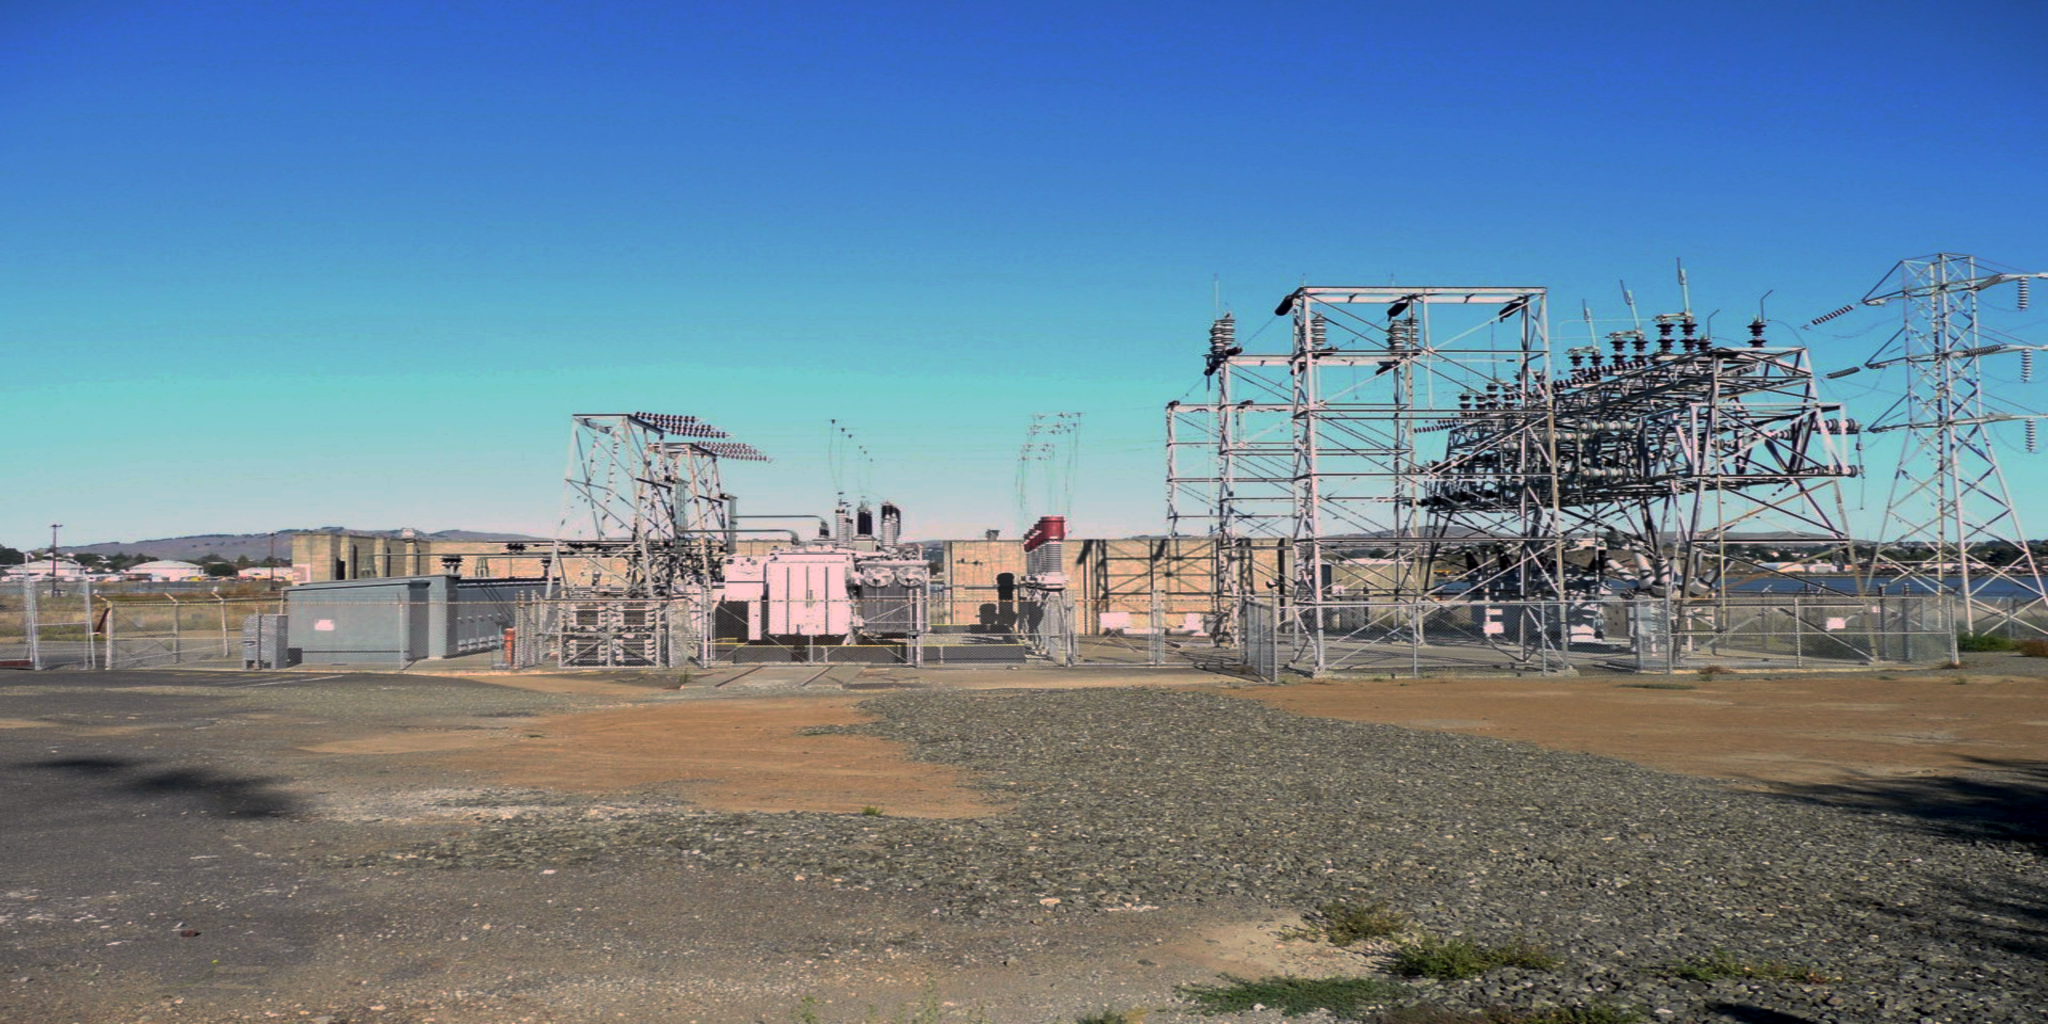
Island Energy operates the electric distribution system on Mare Island, taking 115 kV delivery from the Western Area Power Administration (WAPA) at Station H and distributing at 12.5 kV. The utility wanted to understand where energy was being lost between what it purchased at the substation and what it billed at customer meters – losses that erode the return on every kilowatt-hour sold – and how to reduce them without affecting service.
EETS was engaged to model the system and quantify those losses. Using EDSA load-flow software, EETS modeled the full distribution system: two 115 kV:12.5 kV main transformers, numerous 12.5 kV substations, the associated VFI, PME, and RA switches, and 379 12.5 kV step-down distribution transformers. Historical and customer load data supplied the loading. From that model, EETS separated the energy gap into its real components and produced a prioritized set of efficiency recommendations.
The finding that shaped everything: the system is dramatically over-transformed. Its transformers are loaded to a small fraction of their capacity, and because every energized transformer draws fixed no-load core losses around the clock, that idle capacity – not the delivered load – is where most of the utility’s losses come from.
Modeling the System End to End
EETS built daily load profiles from the utility’s monthly energy records, then divided total consumption between residential and industrial customers using the difference between weekday and weekend usage, and validated that split with an independent calculation based on the concentration of industrial use during weekday business hours. Load was allocated across the transformer fleet in proportion to each unit’s kVA rating, and the seven largest industrial customers – which make up roughly 84% of the industrial load – were profiled individually. From this, EETS computed both the load losses and the fixed no-load losses of every transformer in the system, plus cable losses.
The overall loss was framed against a hard number: the difference between the energy WAPA delivered at 115 kV and the energy customers were billed was 4,150,188 kWh. EETS’s modeled transformer losses of about 2,503,819 kWh per year account for 60.3% of that gap, cable losses for roughly another 2% of delivered energy, and the remaining ≈ 30% for energy that is unaccounted for – which, as the study is careful to note, is not physical loss at all but under-reported usage.
Project Challenge
A System Built Far Larger Than Its Load
The transformer fleet dwarfs the load it serves. The residential transformers are loaded on average to only about 28% of their rating; the transformers serving the seven largest customers, to under 5%; and the remaining industrial transformers to roughly 0.18% – essentially energized and idle. Even the 20 MVA main transformer T1 carries only about a tenth of its capacity. Every one of those energized transformers draws no-load loss – the fixed magnetizing loss needed to keep the core energized – 24 hours a day, 365 days a year, independent of load. That is why no-load losses turned out to be 97.29% of all transformer losses: the problem is not how hard the transformers work, but how many are switched on for how little.
Separating Real Losses from Under-Reported Sales
Not all of the supplied-versus-billed gap is physical loss, and treating it as if it were would have pointed the utility at the wrong fixes. The delivered-energy figure comes from WAPA’s 115 kV metering, which is trustworthy; the billed figure is the sum of customer meters, which is less certain – services sized far larger than their load and meters out of calibration both under-record real usage. The study also had to work within real data limits: some customer records dated to 2009, and power factor had to be assumed at unity where reactive data was missing. Distinguishing genuine loss from under-reporting, and being explicit about the confidence behind each number, was as important as the loss calculation itself.
Client
Island Energy (electric distribution utility, Mare Island)
Sector
Electric Utility – Distribution
Location
Mare Island, Vallejo, California
Services
Load Flow Modeling │ Energy Loss Analysis │ Distribution System Study │ Transformer Right-Sizing │ Metering Review

Drink
As part of this expansion, AWA identified an opportunity to recover energy that was previously being wasted.
Client
Island Energy (electric distribution utility, Mare Island)
Sector
Electric Utility – Distribution
Location
Mare Island, Vallejo, California
Services
Load Flow Modeling │ Energy Loss Analysis │ Distribution System Study │ Transformer Right-Sizing │ Metering Review
Drink
As part of this expansion, AWA identified an opportunity to recover energy that was previously being wasted.
Project Overview
Island Energy operates the electric distribution system on Mare Island, taking 115 kV delivery from the Western Area Power Administration (WAPA) at Station H and distributing at 12.5 kV. The utility wanted to understand where energy was being lost between what it purchased at the substation and what it billed at customer meters – losses that erode the return on every kilowatt-hour sold – and how to reduce them without affecting service.
EETS was engaged to model the system and quantify those losses. Using EDSA load-flow software, EETS modeled the full distribution system: two 115 kV:12.5 kV main transformers, numerous 12.5 kV substations, the associated VFI, PME, and RA switches, and 379 12.5 kV step-down distribution transformers. Historical and customer load data supplied the loading. From that model, EETS separated the energy gap into its real components and produced a prioritized set of efficiency recommendations.
The finding that shaped everything: the system is dramatically over-transformed. Its transformers are loaded to a small fraction of their capacity, and because every energized transformer draws fixed no-load core losses around the clock, that idle capacity – not the delivered load – is where most of the utility’s losses come from.
Modeling the System End to End
EETS built daily load profiles from the utility’s monthly energy records, then divided total consumption between residential and industrial customers using the difference between weekday and weekend usage, and validated that split with an independent calculation based on the concentration of industrial use during weekday business hours. Load was allocated across the transformer fleet in proportion to each unit’s kVA rating, and the seven largest industrial customers – which make up roughly 84% of the industrial load – were profiled individually. From this, EETS computed both the load losses and the fixed no-load losses of every transformer in the system, plus cable losses.
The overall loss was framed against a hard number: the difference between the energy WAPA delivered at 115 kV and the energy customers were billed was 4,150,188 kWh. EETS’s modeled transformer losses of about 2,503,819 kWh per year account for 60.3% of that gap, cable losses for roughly another 2% of delivered energy, and the remaining ≈ 30% for energy that is unaccounted for – which, as the study is careful to note, is not physical loss at all but under-reported usage.
Project Challenge
A System Built Far Larger Than Its Load
The transformer fleet dwarfs the load it serves. The residential transformers are loaded on average to only about 28% of their rating; the transformers serving the seven largest customers, to under 5%; and the remaining industrial transformers to roughly 0.18% – essentially energized and idle. Even the 20 MVA main transformer T1 carries only about a tenth of its capacity. Every one of those energized transformers draws no-load loss – the fixed magnetizing loss needed to keep the core energized – 24 hours a day, 365 days a year, independent of load. That is why no-load losses turned out to be 97.29% of all transformer losses: the problem is not how hard the transformers work, but how many are switched on for how little.
Separating Real Losses from Under-Reported Sales
Not all of the supplied-versus-billed gap is physical loss, and treating it as if it were would have pointed the utility at the wrong fixes. The delivered-energy figure comes from WAPA’s 115 kV metering, which is trustworthy; the billed figure is the sum of customer meters, which is less certain – services sized far larger than their load and meters out of calibration both under-record real usage. The study also had to work within real data limits: some customer records dated to 2009, and power factor had to be assumed at unity where reactive data was missing. Distinguishing genuine loss from under-reporting, and being explicit about the confidence behind each number, was as important as the loss calculation itself.
Engineering Solution
Quantifying Where the Energy Goes
The EDSA model let EETS put a number on each piece of the gap. No-load losses, which depend only on a transformer’s rating rather than its loading, were calculated with high confidence and shown to dominate; load losses were computed from the historical profiles. The result decomposed the 4,150,188 kWh gap into roughly 60% transformer loss (overwhelmingly no-load), about 2% of delivered energy in cable loss, and roughly 30% under-reported usage – turning an unexplained shortfall into a diagnosed, prioritized problem in which the single largest lever is the fleet of lightly loaded, always-energized transformers.
De-energize, Right-Size, and Reallocate
Because the losses are dominated by idle energized capacity, the highest-value fixes are operational rather than capital-intensive. EETS recommended de-energizing transformers that carry no connected load, right-sizing oversized units, and reallocating load so that transformers run nearer their capacity – which then frees still more units to be switched off. As a concrete example, downsizing the 20 MVA T1 to a 5 MVA unit would cut its no-load losses by about 131,490 kWh per year without affecting the load it serves, and new residential transformers should be sized to load at roughly 75–80%, not the 28% seen today. To show the scale of the opportunity, EETS modeled an illustrative ideal in which the industrial load is consolidated onto a few appropriately sized transformers; it cuts annual industrial transformer losses from about 2,258,137 kWh to 33,618 kWh – roughly 96% – offered not as a literal plan but as a measure of what consolidation and right-sizing can achieve.
Tightening Metering and Reporting
The roughly 30% of the gap that is under-reporting points to the metering system. EETS recommended checking industrial customers for faulty meters, non-metered services, and incorrectly sized current transformers, and ensuring meters on small loads are sensitive enough to record usage that is currently slipping through. Smart metering was assessed as a marginal help by comparison with the transformer and metering fixes. Across all of it, EETS recommended documenting every load addition and transformer change, so the model – and the efficiency gains – stay valid over time.
Key Technical Elements
Parameter | Detail |
System Modeled | Two 115 kV:12.5 kV main transformers, numerous 12.5 kV substations, VFI/PME/RA switches, and 379 12.5 kV step-down distribution transformers |
Source | WAPA 115 kV delivery at Station H |
Modeling Tool | EDSA load-flow software (version 2005 Rev2); load data as of October 2012 |
Average Load | Residential ≈ 1,474 kW; industrial ≈ 900 kW; total ≈ 2,374 kW |
Transformer Loading | Residential transformers ≈ 28%; seven largest customers ≈ 4.9%; other industrial ≈ 0.18%; 20 MVA main T1 ≈ 10% |
Annual Transformer Loss | ≈ 2,503,819 kWh (residential ≈ 245,682; industrial ≈ 2,258,137) |
Loss Composition | Transformer loss = 60.3% of the 4,150,188 kWh supplied-vs-billed gap; 97.29% of that is no-load loss; cable ≈ 2% of delivered; ≈ 30% under-reported usage |
T1 Right-Sizing | 20 MVA → 5 MVA cuts no-load loss by ≈ 131,490 kWh/yr |
Illustrative Ideal | Consolidating industrial load cuts industrial transformer loss ≈ 96% (≈ 2,258,137 → 33,618 kWh/yr) – shown to size the opportunity, not as a literal plan |
Recommendations | De-energize idle transformers; right-size and consolidate; size new residential units to 75–80%; correct metering (CTs, calibration, non-metered services); document all changes |
Project Outcome
EETS delivered Island Energy a modeled, quantified account of where its energy goes. Of the roughly 4.15 GWh per year that separated WAPA’s delivered energy from customer billing, about 60% is real transformer loss – almost entirely fixed no-load core loss from a heavily over-transformed system – about 2% is cable loss, and roughly 30% is under-reported usage rather than physical loss. On that foundation the study set out a prioritized path: de-energize idle transformers, right-size and consolidate an oversized fleet (illustrated by downsizing the 20 MVA T1 and by an ideal consolidation that removes some 96% of industrial transformer loss), size new residential transformers to load properly, and tighten metering to recover under-reported sales. The result gives the utility a clear, evidence-based way to cut losses and recover revenue without affecting the energy delivered to customers.
Value Delivered by EETS
EETS turned an unexplained energy gap into a diagnosed, prioritized problem and pointed the utility at the fixes that actually pay back.
A Diagnosis, Not Just a Loss Number
The utility knew energy was going missing; EETS modeled the system to show exactly where. By decomposing the 4.15 GWh gap into transformer loss, cable loss, and under-reporting – and within transformer loss, into load versus no-load – the study converted a vague shortfall into specific, attributable causes. Knowing that no-load losses on idle transformers are 97% of the transformer problem is what makes an effective response possible; a single bottom-line loss figure would not.
Targeting the Losses That Pay Back
Because the dominant losses come from transformers that are energized but barely loaded, the remedy is largely operational – switching off idle units, right-sizing, and reallocating load – rather than expensive new hardware. EETS quantified the payback of those moves, from a single T1 downsizing worth roughly 131,490 kWh a year to a consolidation that could remove about 96% of industrial transformer loss, so the utility can act on the biggest levers first.
Honest About What the Data Can Support
The study is explicit about its own confidence. It separates the trustworthy WAPA supply metering from the less-certain sum of customer meters, labels roughly 30% of the gap as under-reporting rather than loss, and notes where assumptions – unity power factor, and load profiles built partly on older data – bound the accuracy. Grounding the no-load loss findings in fixed, rating-based values that the data cannot distort, while flagging where load-loss figures depend on data quality, gives Island Energy recommendations it can trust and a clear sense of which numbers to firm up next.
Drink
As part of this expansion, AWA identified an opportunity to recover energy that was previously being wasted.